set key autotitle columnhead # uses first row for column names
set datafile separator "," # handles comma-separated-var
Monday, June 12, 2017
Get gnuplot to read python-generated CSV file with header
In gnuplot, this is the magic command:
Thursday, June 8, 2017
Bigger default font size in matplotlib
import matplotlib matplotlib.rcParams.update({'font.size': 18})Tuesday, May 23, 2017
Installing healpy
The python module healpy brings the useful tesselation-terrific functionality of healpix to python. The latest version of healpy is 10.3.1. Unfortunately, the version currently accessible in conda, 1.9.1, is outdated. conda thinks that old version needs an old version of numpy to run.
I have therefore installed healpy with pip:
pip install --user healpy
That appears to work.
I have therefore installed healpy with pip:
pip install --user healpy
That appears to work.
Thursday, February 23, 2017
Barycentric velocity correction for wavelengths
Astropy has all the infrastructure needed to calculate the barycentric correction needed to correct the wavelengths of a spectrum, but hasn't made a wrapper yet. Still an open ticket.
(Gloss: by barycentric velocity correction, I mean removing the radial velocity of the observatory toward the target with respect to the barycenter of the solar system. Affects spectra by up to +-30 km/s, so relevant for moderate or high resolution spectra.)
So, I adapted this gist by Stuart Littlefair. I wrote a small module that computes the barycentric correction and applies it to a spectrum. I tested that it agrees within 0.01 km/s with the correction computed by Jskycalc. Good enough for extragalactic purposes; dunno if safe for exoplanets.
Here's a code snippet that reads in a bunch of spectra and applies the barycentric correction:
def get_the_spectra(filenames, obslog, colwav='obswave') :
df = {}
for thisfile in filenames :
print "loading file ", thisfile
df[thisfile] = pandas.read_table(thisfile, delim_whitespace=True, comment="#")
# Apply the Barycentric correction
thisobs = obslog.loc[thisfile]
keck = EarthLocation.of_site('keck')
my_target = SkyCoord(thisobs['RA'], thisobs['DEC'], unit=(units.hourangle, units.deg), frame='icrs')
my_start_time = Time( thisobs['DATE-OBS'] + "T" + thisobs['UT_START'] , format='isot', scale='utc')
midpt = TimeDelta(thisobs['EXPTIME'] / 2.0, format='sec')
my_time = my_start_time + midpt # time at middle of observation
barycor_vel = jrr.barycen.compute_barycentric_correction(my_time, my_target, location=keck)
print "FYI, the barycentric correction factor for", thisfile, "was", barycor_vel
jrr.barycen.apply_barycentric_correction(df[thisfile], barycor_vel, colwav='obswave', colwavnew='wave') #
df[thisfile]['Nfiles'] = 1 # N of exposures that went into this spectrum
return(df) # return a dictionary of dataframes of spectra
Monday, January 30, 2017
Adjust density of labeled ticks, the easy way
For future reference, here's the easiest way to set the density of labeled ticks on a plot:
In gnuplot:
Source
In gnuplot:
set xtics 4In python matplotlib:
set ytics 3
plt.locator_params(axis='x', nbins=4)
plt.locator_params(axis='y', nbins=3)
Source
Friday, December 2, 2016
Thip! Crinkle! Spoit

Thursday, June 30, 2016
New Tutorials on GitHub
I wrote ipython notebook tutorials for some new packages I've been learning:
- pyds9 (call ds9 image plotting tool from python)
- pyregion (use ds9 regions files in python, including image filtering)
- seaborn (pretty plotting add-on to matplotlib, makes nice density plots). Well actually, it's a mashup of Astropy, Pandas, and Seaborn: the tutorial downloads a machine-readable table from an ApJS journal article, reads it in with astropy, converts it to a Pandas data frame, filters the data, and then plots a density plot using seaborn.
Wednesday, June 29, 2016
Test-driving pyds9
After farting around with matplotlib's crappy imshow, I went sniffling back to cozy ds9. I know that STScI developers are suggesting we all move to Ginga, but it seems a little too bleeding edge just yet. So, I figured out how to call ds9 using the pyds9 package, which uses xpa under the hood to manipulate the ds9 window.
This is a basic example of using the pyds9 package to plot image data in the ds9 viewer, using Python.
This example loads data from a fits file into a numpy ndarray, does math on that array, and then plots the array in ds9. Written 6/2016, as a self-tutorial. Use it if it helps you.import numpy as npThat works great, and is very cozy if you're already used to xpaset. Score!
from astropy.io import fits
from astropy.utils.data import download_file
from astropy.io.fits import getdata
import pyds9
image_file = download_file('http://data.astropy.org/tutorials/FITS-images/HorseHead.fits', cache=True )
(im_int, hdr) = getdata(image_file, header=True) #image is numpy array
im = im_int.astype(np.float64) # convert data from int to float
im +=0.01 # im is a numpy array, so we can do math on it.
d = pyds9.DS9('foo1') # start ds9. 'd' is the way to call ds9
d.set_np2arr(im) # sending ndarray im directly to ds9
d.set("colorbar no") # example of manipulating the ds9 window
d.set("scale zscale") # example of manipulating the ds9 window
d.set("zoom to 0.6 0.6")
Tuesday, April 19, 2016
Poking around with Pandas
Over a beer, Wify told me that I should be using Pandas data frames to read my file of filenames and redshifts.
More ways to sort that Pandas data frame:
This is an exciting start! Clearly, this is a better way for this type of file than astropy's tables, because I can *sort* (high redshift, only spectra with continuum fits, etc.)import pandaspspecs = pandas.read_table(thelist, delim_whitespace=True, comment="#")p.info()pspecs.describe()pspecs[(pspecs.z_ISM > 3)].reset_index() # only those w redshift >3
More ways to sort that Pandas data frame:
wcont = pspecs[pspecs['filename'].str.contains('combwC1')].reset_index() # only w continuum filtlist = pspecs[pspecs['short_label'].isin(labels)].reset_index() # only galaxies w certain names
Monday, April 4, 2016
A simple multi-panel velocity plot
def velocity_plot(wave, fnu, line_label, line_center, redshift, vwin, Ncol) :
'''Make a plot of flux density versus rest-frame velocity for several spectral lines.
Inputs are:
wave: observed wavelength (currently Angstrom)
fnu: flux density (erg/s/cm^2/Hz) ** should this be flambda instead?
line_label: tuple of line labels
line_center: np array of rest-frame wavelengths (Angstroms)
redshift: redshift to assume,
vwin: velocity window to use (km/s)
Ncol: number of columns to plot. Number of rows set automatically.
'''
Nrow = ceil(line_center.size / Ncol) # Calculate how many rows to generate
fig = plt.figure()
restwave = wave / (1.0 + redshift)
for ii, dum in enumerate(line_label) :
print "Trying to plot ", line_label[ii], " at ", line_center[ii]
ax = fig.add_subplot(Nrow, Ncol, ii+1)
vel = (restwave - line_center[ii])/line_center[ii] * A_c/1E5 # km/s
in_window = np.where( (vel >= vwin*-1 ) & (vel <= vwin) )
plt.step(vel[in_window], fnu[in_window])
plt.plot( (-1*vwin, vwin), (1.0,1.0)) # plot unity continuum
plt.ylim(0.0, 1.3) # May need to change these limits
plt.xlim(-1*vwin, vwin)
if ii == len(line_label) -1 :
plt.xlabel("rest-frame velocity (km/s)") # if last subplot, make xlabel
else :
ax.axes.xaxis.set_ticklabels([]) # if not last subplot, suppress numbers on x axis
plt.annotate( line_label[ii], (0.3,0.8), xycoords="axes fraction")
# plt.ylabel("relative fnu")
fig.subplots_adjust(hspace=0)
Progress!
Oh my god, I just wrote a nice routine in a half-hour, that *just worked* the first time I tried it. It plots a given spectral feature for a dozen spectra, with the X-axis selectable as either rest-frame wavelength or velocity.
And on Friday, I started writing a script in perl, and switched to Python, because it would be easier.
Perhaps I'm actually getting comfortable coding in Python. Yay!
And on Friday, I started writing a script in perl, and switched to Python, because it would be easier.
Perhaps I'm actually getting comfortable coding in Python. Yay!
Thursday, March 10, 2016

Wednesday, March 2, 2016
Find files in a dir
for file in os.listdir(thisdir):
if file.endswith("_galfit.fits"):
image, header = fits.getdata(file, 3, header=True)
blagh blagh blagh
Source: Stack overflow
if file.endswith("_galfit.fits"):
image, header = fits.getdata(file, 3, header=True)
blagh blagh blagh
Source: Stack overflow
Friday, February 26, 2016
Convolve with a Gaussian, and rebin
I wrote a code to "Candelize" the source plane image of a lensed galaxy. It convolves witha gaussian to the normal PSF of HST, and then rebins to a normal HST pixel scale. The code I wrote is rebin_image-s1110.py, on my machine. Here are the key nuggets of what it does:
from astropy.convolution import convolve
from astropy.convolution import Gaussian2DKernel
from astropy.stats import gaussian_fwhm_to_sigma # a useful constant
from skimage.measure import block_reduce
# Convolve with a 2D Gaussian
kernel = Gaussian2DKernel(ksize[ii]) #ksize is a stdev, not fwhm
data_out = convolve(data_in, kernel)
# Rebin to normal HST pixel scale
rebinned = block_reduce(data_out, block_size=(binby,binby), func=np.sum) # in skimage
# The rest of the code is just bookkeeping.
Make a directory if it doesn't already exist
outdir = thisdir + "/Candelize/"
if not os.path.exists(outdir): # Make output directory if it doesn't already exist.
os.makedirs(outdir)
Source: Stack overflow
Wednesday, September 16, 2015
Convert vacuum wavelenths to air, using ascii.read() and ascii.write()
import ref_index # python package ref_index does refractive index of air,
# for converting vacuum wavelengths to air wavelengths.
from astropy.io import ascii
import matplotlib.pyplot as plt
tbl = ascii.read("oh-lines-vac")
tbl.colnames # should be vacwave and theo_intens
wave_vac_A = tbl['vacwave'] # vacuum wavelength in angstroms
wave_air_A = ref_index.vac2air(wave_vac_A / 10.) * 10. # ref_index assumes nanometers
plt.plot(wave_vac_A, (wave_vac_A / wave_air_A))
plt.show()
ascii.write([wave_vac_A, wave_air_A, tbl['theo_intens']], names=['wave_vac_A', 'wave_air_A', 'theor_intens'], output='Rousselot_OH_air_and_vac.out')
Update (June 2017) using Pandas, from air to vac:
import pandas
import ref_index
df = pandas.read_table("temp_Nicholls_He_linelist.txt", delim_whitespace=True, comment="#")
df['wave_nist_vac'] = ref_index.air2vac(df['wave_nist_air'] / 10.) * 10.
# That's it. Easy-peasy
Wednesday, July 8, 2015
Reading a FITS file is easy
from astropy.io import fits
data, header = fits.getdata("input_file.fits", [extension number,] header=True)
Seriously, these two lines of code show why we should all be using Astropy.
#Readytojointhecult
data, header = fits.getdata("input_file.fits", [extension number,] header=True)
Seriously, these two lines of code show why we should all be using Astropy.
Monday, June 15, 2015
Notes on GSFC 2015 Python boot camp
The website, with all the ipython notebooks.
Installation:
For the course, using Anaconda b/c it has more up-to-date ipython than ureka.
Ipython needed to run ipyton notebooks used in class
- /Applications/anaconda/bin (added to path in .cschrc)
- Can run everything w "Launcher" in /Applications/anaconda.
- alias to launchexr on desktop
Neat trick: "whos" in ipython shows you what variables are set!!!
In [15]: whos
Variable Type Data/Info
-----------------------------
accel float 9.8
t float 1.0
Operators:
** is the power operator.
^ is NOT POWER! Be careful.
"pow" is power, it's automatic
++ doesn't exist!!
Booleans:
-True, False, None are booleans
- example: >type(True), type(False), type(None) Result: (bool, bool, NoneType)
-isinstance(1,int) retunrs True ;
Strings:
- Strings are immutable. This sounds really weird. They can be redefined,
but individual elements can't be changed.
- r before a string makes it a raw string that ignores special chars:
print r'this is a raw string\n\r'
(This is like single quotes in perl).
- "eggs"*100 prints eggs a hundred times, duh.
- string join operator is +. Perl . does not work.
- s = "spam\n"; print len(s); print s[-1]; print s[2:4]; print s[1:]
# simple example of object that's a string, fnctions that deal with capitalization:
k = 'godzilla'
In [81]: (k[3:5].upper()).title()
Out[81]: 'zi'
# capitalize(), lower(), upper(), swapcase(), title(), all cute.
There is simple string maniuplation that does simplest part of regexp,
may be more readable:
x.replace(), x.split(), x.partition()
x = "foo x bar"
x.partition('x') # splits on x
x.replace(), x.split()
partition() only finds the first separator, and keeps it in. Weird.
split() works more like perl split
count(),
x.startswith("G") checks whether string x starts w G.
x.endswith("endshere") "ends.
x.find()
Simple check for alphanumeric:
"sdfsfkk**".isalpha() would return False, because this string isn't alphanumeric
"60".isdigit() is True, this is a digit.
.islower(), .isupper()
String formatting: Note the % char, before the array at the end
print '%.2f %.3f' % (339,330)
339.00 330.000
Ignore the string module, it's obsolete.
Get simple input from command line:
T = float(raw_input("Enter the teperature in K: ")) #need to cast the input
Enter the teperature in K: 100
Importing/running a python script from w/in python:
% execfile("temperature.py")
Data structures:
To find out what variable v is: > type(v)
To find out what you can do with a variable, in ipython, type v.TAB
LOOPS:
Python uses indendations to mark loops, ugh.
Uses colons to start a loop.
while x<5:
for x in range(1,10):
for i,x in enumerate(a): # Very useful way to loop and keep track of index
print i, x, len(x)
for x in ("this", "is", "an", "example"):
print x
x = range(0,100000,1000); # range([start,] stop[, step]) -> list of integers
# This makes a useful lsit of integers, with selectable start, stop, & step
FUNCTIONS: # Here's how to define one.
def addnums(x=1,y=2) : #this is the header. 1 and 2 are default values
"""Documentation string"""
return x + y #this does the work
# call as
addnums(y=2,x=3) # let's run the function
Commenting:
a triple quote """ used in function is a docstring, used elsewhere
NUMPY and MATPLOTLIB:
numpy arrays need to all have same dataytpe.
can check thusly: print myarray.dtype
new_arr = np.arange(-5,5,1)
new_arr = np.linspace(-3,3,7)
new_arr = np.logspace(1,4,4)
print np.random.rand(10) # get 10 random numbers. can also fill a shaped
print np.random.randn(10) # 10 numbers chosen from randon normal distrib
print np.random.normal(mean,stdev, shape-of-resulting-array)
# WHERE to find things in an np array
redshifts = np.array((3,4,5,6,1,0)
far = np.where(redshifts >2)
redshifts[far]
middle = np.where( (redshifts >= 1) & (redshifts <= 2) ) #ooh! double where!
print middle
print redshifts[middle]
print np.mean(array2)
numpy has a standard format, np.savetxt('output.txt', array, fmt='%.2e')
np.loadtxt, np.genfromtext
TUPLE:
a tuple is a constant list. Cannot change elements
list -- can change the elements. ok to have different datatypes
array -- numpy, similar to list, but all elelemts have same datatype
python prints numpy arrays with no commas. lists have commas
can also type() them
Advanced python: (Day 01)
"list comprehension" is a fast way to make a list, without a for loop.
cute but not critical
SCOPE:
global a # defines a variable as a global variable
*arg - a list of arguments. required
**kwargs - a list of keyword key=value pairs.
MODULES:
ip> from numpy import int[TAB], shows you the numpy modules starting w int
reload(module_name) # reload module when you've edited it.
ipython fanciness:
%lsmagic # lists all the magic functions
%quickref # quick reference on ipython
%reset
%doctest_mode
%history -f logfile.out
%pdb - python dbugger
%load_ext rmagic # run R from Python
%save -f saved_work.py #save your work
%run saved_work.py #load it back in
%%perl, run an ipython cell with perl in a subprocess
%%! (do stuff in the shell for a while, until a blankline return)
#Lots of great stuff in Jeremy's talk about ipython,
#especially how to talk to the command line and back. Flew by fast,
#so I re-read it carefully at home.
# this is like backticks in perl:
from_shell = !ls *.cat
!touch "$from_shell[0]"."new"
from_shell? # tells you about this new variable
from_shell?? # more verbose
%notebook -e mystuff.ipynb # dumps your term history to an iphython notebook
THIS IS GENIUS FOR DOCUMENTING WHAT YOU DID, if you were farting
in a terminal, figured something out, and want to document it.
When matplotlib is inline, figures are in notebook. To save the figures, add:
savefig('figure.pdf') #in same notebook cell as the plotting command
OK, I'm sold. the ipython notebook is an excellent way to document the flow
of scientiifc analysis. Esp b/c you can run perl scripts, command line
stuff, whatever, with a ! bang
I need to start writing every .diary as a _diary.ipynb ** Promise myself this
Why 1 or 2 percent signs:
-- one % is the line magic, which acts on one line of code
-- two %% acts on a whole cell in an ipython notebook
%%script perl : Run some perl code in a cell
!cat foobar # the bang lets you work on the command line
%load http://matplotlib.sourceforge.net/mpl_examples/pylab_examples/integral_demo.py # runs some example code from the internet. Yowsa
!ipython nbconvert mystuff.ipynb --to pdf # convert to PDF.
There is also an online viewing site. Useful for sharing.
There are shortcut keys to make it much faster to write ipython notebooks.
In the notebook, check Help, Keyboard Shortcuts
Licensing: NASA open source agreement v1.3. So there are procedures
for sharing NASA software.
Matplotlib:
running ipython --pylab automaticlly loads numpy as np, matplotlib.pylab as plt
There's a matplotlibrc file, to make defaults less dumb: http://matplotlib.org/users/customizing.html
How to format strings like in perl:
print "%.3f" % (math.pi) #the % sign is the key operator here.
print "%010f" % math.pi
"Here is formatted pi: {0:.3f}".format(math.pi)
# place format what gets formatted
# The syntax here is weird. {place : formatting} Study this!
Formatting strings, use nameofstring.format()
"on {1}, I feel {0}".format("saturday", "groovy")
Regular expressions!
re.split is more powerful than built-in split. Looks more like perl splitline = "I like the number 234 and 21."
re.split("([kn])", line) # splits on either k or n. Ah, regexp
re.match("\.","thistringlacksaperiod") will return None, since no match.
# many ways to read a file: read, readlines, asciitable
module lets you run subcommands
os.system("sed s/love/hate/g %s > temp" % infile)
os.system("sed s/is/not/g temp2 > temp3")
#Lambda functions:
-lambda is a reserved keyword. Cannot use it for wavelength.
- Used for short, one-liner functions. If longer, name a function
- very nifty, can do function in 1 line
(lambda x,y: x**2+y)(2,4.5) # forget about creating a new function name...just do it!!
How to get inline help about a variable:
xx = 448
type(xx)
xx? # tell me about variable xx
xx??
help(xx)
xx.<TAB> shows you what you can do w this type of object
numpy.shape(xx) # tells you the shape of an array
dir(xx) #oh god, all the methods, functions, etc than can be done to xx
How to get help for a built-in function: help('lambda'), help('&')
numpy.linspace? # gives inline help
numpy.lin<TAB> shows you what functions in numpy start with lin.
Python has Map and Filter functions, like perl. I don't care yet.
Filter filters a list, return all elements where function is True
#Terri's slides had a very useful way to sort by several different columns
airline.flights.sort(key=operator.itemgetter(4,1,0))
Should wrap volatile (may fail) code in Try, Except, Finally wrapper
Python can forget about a varible, with del: "del x"
To run things in ipython to debug:
%run OO_breakout.py
%run -i hello.py # does some trickery, keeps in namespace? look up later
a=b means that a follows b from here on, HOWEVER b changes later!
So it's not the way we normally think of assignment.
Copy does something different:
c=copy.copy(a)
PANDAS: I really don't care yet. Not astronomy-specific.
Perl 2 python: http://everythingsysadmin.com/perl2python.html
THIS LOOKS GREAT! Print it out, bookmark it!
Perl/python phrasebook: https://wiki.python.org/moin/PerlPhrasebook
#I asked Jeremy how to organize my Python scripts. He suggested I
#add a local dir to PYTHON_PATH, that has my files. This will
#make them globally visible to my python. Centralize, so I can canibalize.
Scipy is a big module of math and science programs.
-Includes numpy, matplotlib, ipython.
-scipy uses numpy arrays
-Rpy -- interface to R
-zis there an IDLPy wrapper?
MPFIT and MPFITFUN *have* been imported to Python, yay.
There are other ways of doing things, scipy.optimize.
Terri, Errors, Exceptions, Traceback:
DEBUGGER:
different ways to invoke:
pdb.pm() is the perl debugger post-mortem: it's like ILD STOP, but it
stops where the code dies, and lets you look around, work
pdb.set_trace() # sets cookies where you think your code is failing
pdb.run('myexamplecode.main()')
python /usr/stsci/pyssg/Python-2.7/lib/python2.7/pdb.py wed_breakout2.py
# this runs the python debugger on the command line
Andy Ptak's talk on astronomy applications
fits:
astropy.io.fits: FITS file handling. will subsume pyfits
asciitable will also be absorbed into astropy
astropy.constants is amazing! Can convert, combine units wantonly, it
keeps track.
from ds9 import * # now can display images in ds9, from python
#works on xpaset, xpaget, so ds.get(), ds.set()
Other random notes:
-Convolution in astropy is better than scipy, because it can handle NaNs.
-python-crontab: module to handle crontab
-Class website: github.com/kialio/python-bootcamp
-Jeremy Perkins was a gnuplot + perl user, switched to Python.
-very good parallelization: "import cloud"
Astropy has come up with some great tutorials since I last looked.
I have worked through them. They're lovely, good references.
Just google "astropy tutorials"
Friday, June 12, 2015
Wednesday, June 10, 2015
Perl to Python cheat sheet and phrasebook
Perl 2 Python from a perl sysadmin This looks great! Bookmark the hell out of this!
Perl/python phrasebook Side-by-side examples of doing things in perl, then in python.
These are less frustrating to read than general Python tutorials, b/c they assume you already know how to do a thing in Perl, and just show you the equivalent in Python.
Perl/python phrasebook Side-by-side examples of doing things in perl, then in python.
These are less frustrating to read than general Python tutorials, b/c they assume you already know how to do a thing in Perl, and just show you the equivalent in Python.
Friday, November 1, 2013
What is the Python equivalent of perl's backtics?
One of my favorite features in perl is backtics: They execute something on the command line, and load the output as a variable:
> @config_filenames = `ls *.config`; # loads all the config files in this directory
Easy, huh? Here's the equivalent in python. Not as short, but it works:
include commands
dothis = "ls *.config"
temp = commands.getoutput(dothis)
> @config_filenames = `ls *.config`; # loads all the config files in this directory
Easy, huh? Here's the equivalent in python. Not as short, but it works:
include commands
dothis = "ls *.config"
temp = commands.getoutput(dothis)
Thursday, October 24, 2013
My notes from the GSFC Python boot camp
very good parallelization: "import cloud"
Neat trick: "whos" in ipython shows you what variables are set!!!
In [15]: whos
Variable Type Data/Info
-----------------------------
accel float 9.8
t float 1.0
Operators:
** is the power operator.
^ is a bitwise operator, very different from power! Be careful.
Strings:
- Strings are immutable. This sounds really weird.
- r before a string makes it a raw string: print r'this is a raw string\n\r'
- "eggs"*100 prints eggs a hundred times, duh.
- string join operator is +. Perl . does not work.
- s = "spam\n"; print len(s); print s[-1]; print s[2:4]; print s[1:]
Get simple input from command line:
T = float(raw_input("Enter the teperature in K: ")) #need to cast the input
Enter the teperature in K: 100
Data structures:
To find out what variable v is: > type(v)
To find out what you can do with a variable, in ipython, type v.TAB
for i,x in enumerate(a): # Very useful way to loop and keep track of index
print i, x, len(x)
x = range(0,100000,1000); # range([start,] stop[, step]) -> list of integers
# This makes a useful lsit of integers, with selectable start, stop, & step
FUNCTIONS: # Here's how to define one.
def addnums(x,y):
return x + y
addnums(2,3)
SCOPE:
global a # defines a variable as a global variable
*arg - a list of arguments. required
**kwargs - a list of keyword key=value pairs.
MODULES:
ip> from numpy import int[TAB], shows you the numpy modules starting w int
reload(module_name) # reload module when you've edited it.
ipython fanciness:
%lsmagic # lists all the magic functions
%quickref # quick reference on ipython
%reset
%doctest_mode
%history -f logfile.out
%pdb - python dbugger
%load_ext rmagic # run R from Python
%save -f saved_work.py #save your work
%run saved_work.py #load it back in
%%! (do stuff in the shell for a while, until a blankline return)
#Lots of great stuff in Jeremy's talk about ipython,
#especially how to talk to the command line and back. Flew by fast,
#so I re-read it carefully at home.
# this is like backticks in perl:
from_shell = !ls *.cat
!touch "$from_shell[0]"."new"
from_shell? # tells you about this new variable
from_shell?? # more verbose
Matplotlib:
running ipython --pylab automaticlly loads numpy as np, matplotlib.pylab as plt
How to format strings like in perl:
print "%.3f" % (math.pi) #the % sign is the key operator here.
print "%010f" % math.pi
"Here is formatted pi: {0:.3f}".format(math.pi)
# place format what gets formatted
# The syntax here is weird. {place : formatting} Study this!
Formatting strings, use nameofstring.format()
"on {1}, I feel {0}".format("saturday", "groovy")
Regular expressions!
re.split is more powerful than built-in split. Looks more like perl splitline = "I like the number 234 and 21."
re.split("([kn])", line) # splits on either k or n. Ah, regexp
# many ways to read a file: read, readlines, asciitable
module lets you run subcommands
os.system("sed s/love/hate/g %s > temp" % infile)
os.system("sed s/is/not/g temp2 > temp3")
#Lambda functions:
-lambda is a reserved keyword. Cannot use it for wavelength.
- Used for short, one-liner functions. If longer, name a function
- very nifty, can do function in 1 line
(lambda x,y: x**2+y)(2,4.5) # forget about creating a new function name...just do it!!
#Terri's slides had a very useful way to sort by several different columns
airline.flights.sort(key=operator.itemgetter(4,1,0))
Should wrap volatile (may fail) code in Try, Except, Finally wrapper
Python can forget about a varible, with del: "del x"
To run things in ipython to debug:
%run OO_breakout.py
a=b means that a follows b from here on, HOWEVER b changes later!
So it's not the way we normally think of assignment.
Copy does something different:
c=copy.copy(a)
#I asked Jeremy how to organize my Python scripts. He suggested I
#add a local dir to PYTHON_PATH, that has my files. This will
#make them globally visible to my python. Centralize, so I can canibalize.
Scipy is a big module of math and science programs.
-Includes numpy, matplotlib, ipython.
-scipy uses numpy arrays
-Rpy -- interface to R
-zis there an IDLPy wrapper?
MPFIT and MPFITFUN *have* been imported to Python, yay.
There are other ways of doing things, scipy.optimize.
Terri, Errors, Exceptions, Traceback:
DEBUGGER:
different ways to invoke:
pdb.pm() is the perl debugger post-mortem: it's like ILD STOP, but it
stops where the code dies, and lets you look around, work
pdb.set_trace() # sets cookies where you think your code is failing
pdb.run('myexamplecode.main()')
python /usr/stsci/pyssg/Python-2.7/lib/python2.7/pdb.py wed_breakout2.py
# this runs the python debugger on the command line
Andy Ptak's talk on astronomy applications
fits:
astropy.io.fits: FITS file handling. will subsume pyfits
asciitable will also be absorbed into astropy
astropy.constants is amazing! Can convert, combine units wantonly, it
keeps track.
from ds9 import * # now can display images in ds9, from python
#works on xpaset, xpaget, so ds.get(), ds.set()
Convolution in astropy is better than scipy, because it can handle NaNs.
python-crontab: module to handle crontab
Class website: github.com/kialio/python-bootcamp
Friday, June 14, 2013
GSFC Python Bootcamp
I took the 3-day Python Bootcamp at NASA Goddard, which was based on a similar course at Berkeley.
It was darned useful.
One of many things I learned is that Ipython makes life better:
It was darned useful.
One of many things I learned is that Ipython makes life better:
- "whose" #tells you what variables are defined
- %lsmagic # lists all magic functions
- %quickref # quick reference in ipython
- %reset # clear all the variables. Faster than exiting, restarting
- %history -f logfile.out # save history to a file
- %save -f saved_work.py # save work to a file
- %run saved_work.py # load that work back in
- %pdb # turn on the Python debugger
- %load_ext rmagic #run R statistics package
- %%! # work in the shell for a while, until blankline [enter]
- ipython --pylab #automatically loads numpy as np, matplotlib.pylab as plt
- typing mystring.[Tab][Tab] tells me what methods are available to work on mystring.
I may copy over more from my notes later.
I wish there had been expanded content about matplotlib, scipy, and pyfits. Maybe we should organize an astronomy bonus session later this summer.
Friday, January 18, 2013
Great Python workshop at AAS
Demitri Muno held a great workshop at the 2013 Long Beach AAS, "Astronomers Learning Python" or somesuch. Here are my notes on the best stuff I learned.
- To make your code not care where python is, start as "env python".
- None is a special null value. Better than declaring value as -999.
- The string join operator is +.
- Triple quotes are pretty powerful: d = ''' this is a single string with everything included including linefeeds.'''
- Dictionaries behave like hashes in perl. Lots of useful ways to sort, work with them.
- Since whitespace controls loops in python, you must pick tabs or spaces, and be consistent. They recommend tabs.
- Both ! and "not" are the not operator, but "not" is more readable, so preferred.
- Here's how to efficiently loop, and keep track of the index in the loop:
a = ['a', 'b', 'c']for index, item in enumerate(a):print index, item
- String formatting (this is preferred over deprecated %d style):
print "xxx {0}, {1}".format(math.pi, "b")
- It is harder to code in python using a standard text editor (emacs or vi). Better to use a dedicated coding editor. It will help you! He recommends TextWranger.
More later!
Monday, December 31, 2012
Fast way to make monotonic arrays
x = arange( 0.0, 5.65, 5.65/50)
Is a nice way to make 50 increasing numbers, from 0 to 5.65.
How to use python for remote graphics?
iPython's interface is quite when you're on-console. But it's New Year's Eve, and I want to remotely display python, so that I can work from home. I cannot figure out how to do this. Any suggestions?
Friday, September 21, 2012
Simple array math
Okay, this is embarassing, but I'm owning up to it. It took me a while to figure out how to get python to do something that IDL does intuitively: math on arrays. For example, let's redshift some emission lines:
My student Alice, as usual, showed me the solution:
IDL> zz = 3.14Try guessing the equivalent in python, and you get yelled at:
IDL> waves = [4959., 5007., 6563.]
IDL> print, waves * (1.0+zz)
20530.3 20729.0 27170.8
TypeError Traceback (most recent call last)
/Volumes/Apps_and_Docs/jrrigby1/<ipython console> in <module>()
TypeError: unsupported operand type(s) for /: 'list' and 'float'
My student Alice, as usual, showed me the solution:
In [3]: from numpy import array
In [4]: zz = 3.14
In [6]: wave = array([4959, 5007, 6563])See those stupid square brackets? They're not optional:
In [7]: print wave * (1.0+zz)
[ 20530.26 20728.98 27170.82]
wave = array([foo, bar, foo])
Thursday, August 30, 2012
The Angstrom symbol
Update, use the latex mode of python. The r means it's a raw string:
plt.xlabel(r'wavelength($\AA$)')
Another example stolen from stackoverflow:
In the weird multiaxis environment I was in, I needed this:
upper.set_xlabel(ur"observed-frame vacuum wavelength (\u00c5)")
But if I had just been in a regular plot, this should have worked:
xlabel = ur"Wavelength (\u00c5)"
The "ur" chooses the font, I think, and the \u00c5 hieroglyphics asks for an Angstrom in unicode.
Source (answer provided by an STScI person.)
plt.xlabel(r'wavelength($\AA$)')
Another example stolen from stackoverflow:
plt.ylabel(r'Microstrain [$\mu \epsilon$]')In the weird multiaxis environment I was in, I needed this:
upper.set_xlabel(ur"observed-frame vacuum wavelength (\u00c5)")
But if I had just been in a regular plot, this should have worked:
xlabel = ur"Wavelength (\u00c5)"
The "ur" chooses the font, I think, and the \u00c5 hieroglyphics asks for an Angstrom in unicode.
Source (answer provided by an STScI person.)
Auto-generate PDF output
I'm plotting 4 panels of spectra with line identifications on screen. I just figured out a quick way to automatically generate a multipage PDF of my multi-panel plots:
Add this near the beginning of the plotting script:
plt.savefig("output_plot.pdf", bbox_inches='tight', pad_inches=0.1)
Add this near the beginning of the plotting script:
from matplotlib.backends.backend_pdf import PdfPages
pp = PdfPages('multipage.pdf')
Add this where you generate each panel:
pp.savefig()
Finally, add this at the end to close the file:
pp.close()Update: By default, Matplotlib pads acres of whitespace around the PDF. That's annoying when embedding PDF plots in a latex paper. Here's how to prevent the whitespace:
plt.savefig("output_plot.pdf", bbox_inches='tight', pad_inches=0.1)
Tuesday, August 28, 2012
Matplotlib bawls when it loses a font
Now this is a whiny, whiny error:
RuntimeError: Could not open facefile /sw/lib/python2.6/site-packages/matplotlib/mpl-data/fonts/ttf/Vera.ttf; Cannot_Open_Resource
Apparently Matplotlib caches fonts, and then bawls when it can't find them. Here's the stupid solution.
First, find out where your matplotlib config file lives:
matplotlib.get_configdir() In my case, it's ~/.matplotlib
Then, remove the font list cache:
mv ~/.matplotlib/fontList.cache ~/.matplotlib/fontList.cache-old
Tuesday, July 24, 2012
A second y-axis in matplotlib
Simple code to add a second y-axis in matplotlib:
Adapted from twinx.py

from mpl_toolkits.axes_grid1 import host_subplot
import matplotlib.pyplot as plt
host = host_subplot(111)
par = host.twinx()
host.set_xlabel("Distance")
host.set_ylabel("Density")
par.set_ylabel("Temperature")
p1, = host.plot([0, 1, 2], [0, 1, 2], label="Density")
par.set_ylim(0,4)
plt.show()
Adapted from twinx.py

Now, I'm trying to figure out how to keep the first Y axis as the basic one. For example, if I grab the x,y coords of a button press (via fig.canvas.mpl_connect('button_press_event', onclick), they will be for the second y axis, not the first. I wonder how to fix this?
Thursday, July 19, 2012
How to click at specific locations on a plot and use x,y coords?
I want to add some interactive fitting to my plotting. Specifically, I want to click at a position, have the code fit a gaussian there, and overplot the result. You would think this is easy to find, right? No. It took me 30 min of walking down blind alleys in the matplotlib documentation. But let's cut to the chase.
The answer is: Event connections.
I stole the example code in the above link, cleaned it up, and adapted it to my 4-panel figure:
That really should NOT have taken so long to figure out. Grr. But thanks to the great Adam of pyspeckit fame for setting me on the right path!
Here is the red herring I pursued first: matplotlib.widgets, Maybe this will be good for something else later...
Simple examples of how to use matplotlib's widgets. (I've copied them locally to ~/Python/Matplotlib-examples.) Let's work through them.
slider_demo.py: Ooh, shiny! I can interactively change the amplitude, frequency, and color of a sine curve. What's amazing is how terse the code is -- only 43 lines!
radio_buttons.py is also useful.
span_selector.py does what I want, but all the functionality is hidden
BTW, there's a nomenclature difference from other languages: the Cursor widget just shows where the cursor is. It tracks your movements, but does NOT appear to grab the value.
The answer is: Event connections.
I stole the example code in the above link, cleaned it up, and adapted it to my 4-panel figure:
def onclick(event): # Print x,y location where I clicked
print 'button=%d, x=%d, y=%d, xdata=%f, ydata=%f'%(
event.button, event.x, event.y, event.xdata, event.ydata)
for j in range(0,Nfigs):
fig = pylab.figure(num=j+1, figsize=plotsize) #from matplotlib
for i in range(0, Npanels/Nfigs):
blagh blagh plot each panel of the figure.
fig.canvas.mpl_connect('button_press_event', onclick) #monitor each figure for a click
That really should NOT have taken so long to figure out. Grr. But thanks to the great Adam of pyspeckit fame for setting me on the right path!
Here is the red herring I pursued first: matplotlib.widgets, Maybe this will be good for something else later...
Simple examples of how to use matplotlib's widgets. (I've copied them locally to ~/Python/Matplotlib-examples.) Let's work through them.
slider_demo.py: Ooh, shiny! I can interactively change the amplitude, frequency, and color of a sine curve. What's amazing is how terse the code is -- only 43 lines!
radio_buttons.py is also useful.
span_selector.py does what I want, but all the functionality is hidden
BTW, there's a nomenclature difference from other languages: the Cursor widget just shows where the cursor is. It tracks your movements, but does NOT appear to grab the value.
Thursday, April 5, 2012
Equivalent of IDL's "stop" command?
import sys
print "hello world"
sys.exit()
print "this does not print"
print "hello world"
sys.exit()
print "this does not print"
Wednesday, March 14, 2012
Plotting a figure with multiple panels
Alice kindly showed me how to plot a multi-panel figure, in this case, a long echelle spectrum. Thanks, Alice!
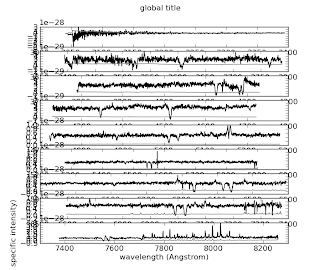 Tada! pylab.subplot is a really powerful command. What's more, I can interactively adjust the size, aspect ratio, etc of the resulting figure, and save it, without needing separate presets for screen and file. Wow! I'm starting to see why people love python.
import sys
import os
import pylab
inE = 'infile.txt'
Npanels = 9
fig = pylab.figure(num=1) #from matplotlib
# loadtext actually comes from numpy, which pylab has.
wavelength,flux,sigma = pylab.loadtxt(inE, comments="#", skiprows=3, usecols=(0,1,2), unpack=True)
length = len(wavelength)
for i in range(0, Npanels):
format = Npanels*100 + 11 # makes label: 311 for 3 rows, 1 col, start at 1
pylab.subplot(format + i)
start = i*(length/Npanels)
end = start + length/Npanels
pylab.plot(wavelength[start:end], flux[start:end], 'k')
pylab.plot(wavelength[start:end], sigma[start:end], '0.5')
pylab.xticks()
pylab.xlabel('wavelength (Angstrom)')
pylab.ylabel('specific intensity)')
pylab.suptitle('global title')
Friday, March 9, 2012
Installing python modules
My sysadmins have installed STScI's python, which lives in /usr/stsci/pyssg. This means that modules have to be installed as root. But root doesn't know that this is the right python directory. Here's the workaround:
> sudo tcsh
> source ~username/.cshrc
> easy_install the-python-package, OR
> python setup.py install
> exit
Three ways to read in a data file, then plot it [UPDATED: + 1!]
UPDATE
#2: There are now 5 methods that I've tried. My clear favorite is Pandas Data Tables. It's much more powerful than Astropy tables, and no harder to use. Here it is:
pspecs.keys()
pspecs.head()
pspecs.tail()
UPDATE: Astropy has standardized this process, so I'm adding one more method. Python4Astronomers recommends using this way. An example:
from astropy.io import ascii
import matplotlib.pylab as plt
tbl = ascii.read("simple_table.csv")
tbl.colnames
print tbl['col1']
plt.plot(tbl['col1'], tbl['col2']
plt.show()
Below is obsolete, and useful only to show how frustrating the standard Python tutorials can be for scientists. They treat "read in a text file, and manipulate its data" as a curiosity, rather than our bread and butter. If only "Python for Data Analysis" had been written when I started learning Python!
First, venting about tutorials:
So, sans tutorials, but with my wife holding my hand, I wrote a basic python script that reads in a text file, and plots the data. It reads in the text file as perl would: line by line, laboriously, which I understand is not in the python spirit, but I wanted to see how to go line-by-line if need be. So here is "simple-read-in-and-plot-demo.py":

Next, let's try that again, but using the numpy function "loadtxt" to read in the spectrum. (loadtxt is kinda like readcol in IDL. Here's a nice tutorial on loadtxt.) Way shorter code:
So example two made the same output, but with a much shorter, higher-level code. Actually that wasn't that painful. Wish I'd found loadtxt at the beginning!
Now, let's do this a third way, using the powerful, flexible, and intimidating package asciitable. It supports all kind of astronomy tables, including tables from IRAF's daophot, CDS, latex, and even (shudder) fixed-width tables. The default output is a NumPy record array: "this powerful container efficiently supports both column-wise and row access to the table and comes with the full NumPy stack of array manipulation methods." (Which sounds powerful, but I have no idea how to use it. Of course the documentation for a record array is absolutely opaque for a newbie.) But I figured out the simplest usage:
So that was a pretty rewarding exercise! Took all fricking morning, but now I know how to read in ascii text files and do simple plotting. (Next, I should read Perry's tutorial...)
import pandaspspecs = pandas.read_table(thelist, delim_whitespace=True, comment="#")p.info()pspecs.keys()
pspecs.head()
pspecs.tail()
UPDATE: Astropy has standardized this process, so I'm adding one more method. Python4Astronomers recommends using this way. An example:
from astropy.io import ascii
import matplotlib.pylab as plt
tbl = ascii.read("simple_table.csv")
tbl.colnames
print tbl['col1']
plt.plot(tbl['col1'], tbl['col2']
plt.show()
Below is obsolete, and useful only to show how frustrating the standard Python tutorials can be for scientists. They treat "read in a text file, and manipulate its data" as a curiosity, rather than our bread and butter. If only "Python for Data Analysis" had been written when I started learning Python!
First, venting about tutorials:
- I am ready to throw python out of a tall building. The tutorials are terrible. I don't care about tuples yet; I just want to load a text file, plot x vs y, and maybe flag some of the datapoints. That's not so hard, is it?
- The most relevant tutorial I've found is Using Python for Interactive Data Analysis (from STScI). But it assumes your input files are .FITS, which isn't helpful when you have simple .text files. There's no section on "Reading in data from a text file". Why not?
- The matplotlib demos are even worse, because they auto-generate fake data. Cute, but would it kill them to have an example of actually reading in real data?
So, sans tutorials, but with my wife holding my hand, I wrote a basic python script that reads in a text file, and plots the data. It reads in the text file as perl would: line by line, laboriously, which I understand is not in the python spirit, but I wanted to see how to go line-by-line if need be. So here is "simple-read-in-and-plot-demo.py":
# minimal plot of spectrum in python
import sys
import os
import numpy
from pylab import *
wavelength = []
flux = []
sigma = []
inE = 'infile.txt'
myfile = open(inE)
for line in myfile:
if line.startswith('#'):
continue
else:
line = line.strip() # like chomp in perl
fields = line.split()
wavelength.append(fields[0])
flux.append(fields[1])
sigma.append(fields[2])
for i in range(0,5):
print wavelength[i], flux[i]
plot(wavelength, flux, linewidth=1.0)
xlabel('wavelength (Angstrom)')
ylabel('specific intensity)')
title('Please work')
grid(True)
show()

Victory! That was extremely painful, but educational.
Next, let's try that again, but using the numpy function "loadtxt" to read in the spectrum. (loadtxt is kinda like readcol in IDL. Here's a nice tutorial on loadtxt.) Way shorter code:
# minimal plot of spectrum in python, now with loadtxtYay for numpy.loadtxt! You can set your delimiter and datatype, if you need to. One word of advice: that "unpack=True" bit is needed to write simple arrays, rather than weird multidimensional python arrays. It's the ThippCrinkleSplort=no setting.
import sys
import os
import numpy
from pylab import *
inE = 'somedata.txt'
wavelength,flux,sigma = numpy.loadtxt(inE, comments="#", skiprows=3, usecols=(0,1,2), unpack=True)
plot(wavelength, flux)
xlabel('wavelength (Angstrom)')
ylabel('specific intensity)')
title('This was a bit easier')
show()
So example two made the same output, but with a much shorter, higher-level code. Actually that wasn't that painful. Wish I'd found loadtxt at the beginning!
Now, let's do this a third way, using the powerful, flexible, and intimidating package asciitable. It supports all kind of astronomy tables, including tables from IRAF's daophot, CDS, latex, and even (shudder) fixed-width tables. The default output is a NumPy record array: "this powerful container efficiently supports both column-wise and row access to the table and comes with the full NumPy stack of array manipulation methods." (Which sounds powerful, but I have no idea how to use it. Of course the documentation for a record array is absolutely opaque for a newbie.) But I figured out the simplest usage:
import asciitable
from pylab import *
inE = 'input.txt'
data = asciitable.read(inE)
plot(data.col1, data.col2) # See? columns are in col1, col2, etc...
show()
So that was a pretty rewarding exercise! Took all fricking morning, but now I know how to read in ascii text files and do simple plotting. (Next, I should read Perry's tutorial...)
Friday, January 27, 2012
Tutoriality I
Time for a tutorial. Let's try AstroPython's "Getting started with Python in astronomy." That sounds superfriendly and relevant.
Hmm, its first recommendation is Dive Into Python. Here's the book as a PDF, zipped. Skipping chapter 1 b/c my sysadmin told me what to install. Skipping Chapter 2 b/c it's terrifying and opaque. On to Chapter 3. Things I learn:
1) A dictionary in Python is like a hash in Perl. OK. Worth knowing for later.
2) Lists in python work a lot like arrays in perl:
ipython -pylab
And search for an occurrence of a value:
Now this part makes no sense yet:
Hmm, its first recommendation is Dive Into Python. Here's the book as a PDF, zipped. Skipping chapter 1 b/c my sysadmin told me what to install. Skipping Chapter 2 b/c it's terrifying and opaque. On to Chapter 3. Things I learn:
1) A dictionary in Python is like a hash in Perl. OK. Worth knowing for later.
2) Lists in python work a lot like arrays in perl:
ipython -pylab
In [8]: foo=['a', 'b', 'c', 'd']And I can add lists together with the + sign, as God intended.
In [9]: foo[-1]
Out[9]: 'd'
In [10]: foo[0]
Out[10]: 'a'
And search for an occurrence of a value:
In [17]: foo.index('c')And test boolean statements:
Out[17]: 2
In [19]: "d" in fooAnd strip out values:
Out[19]: True
In [20]: foo.remove('c')There's "pop", too, which is an old friend from perl.
In [21]: foo
Out[21]: ['a', 'b', 'd']
Now this part makes no sense yet:
In [27]: li = [1, 2]The * operator acts on lists as a repeater. OK that's weird. But it barfs if the operator acts on a float: "* 3.0". So if we're bookkeeping floats correctly, that would complain.
In [28]: li * 3
Out[28]: [1, 2, 1, 2, 1, 2]
OK, now to Tuples. "A tuple is an immutable list. A tuple can not be changed in any way once it is created." Got it. It's defined the same way as a list, except it gets round parentheses:
The Tuple function turns a list into a tuple. The builtin List function turns a tuple into a list. "In effect, Tuple freezes a list, and List thaws a tuple." Got it.
Now on to variables. Thank god, I don't need to explicitly type variables. Like perl, it just figures out what the variable is given the value.t = ('you', 'no', 'be', 'changing', 'my', 'tuple')And since a tuple is immutable, you can't pop, append, or extend it. Nor can you find elements via "index". So why do I need a tuple? OK, they're faster, and useful if you want read-only data. And they're good as keys in dictionaries. OK, but I don't care yet.
In [37]: t[3]
Out[37]: 'changing'
The Tuple function turns a list into a tuple. The builtin List function turns a tuple into a list. "In effect, Tuple freezes a list, and List thaws a tuple." Got it.
Let's get this party started
First I need to download stsci_python, the python (and other stuff) package that my sysadmin recommends.
Then added 3 lines to my .cshrc:

Then added 3 lines to my .cshrc:
# STSci Python IRAF etc
if ( -f /usr/stsci/envconfig.mac/cshrc ) source /usr/stsci/envconfig.mac/cshrc
iraf
Checking, "which python" returns: /usr/stsci/pyssg/Python-2.7/bin/python
Good. Next, "ipython -pylab" , and then make the Hello World plot:
x = randn(1E5)
hist(x,100)

Hell yeah, I made some python.
I am going to learn Python, dammit.
OK, finally. I am going to learn Python. So far I've gotten by as a professional astronomer with a combination of perl, pgplot, IDL, and iraf. I used to think perl was all I needed. But I'm tired of all the kids these days bragging about how easy Python is, that it's free and powerful. I'm tired of not being able to read my students' code. So I'm going to learn python, dammit.
Read along, if you care. Maybe you'll help me. Maybe I'll help you.

Read along, if you care. Maybe you'll help me. Maybe I'll help you.
Subscribe to:
Posts (Atom)